Road Advocacy Riding Toward a Safer Golden Gate Bridge
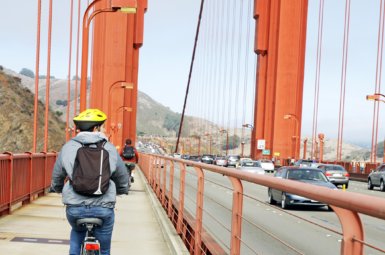
Crossed by thousands of riders on a daily basis, the Golden Gate Bridge is a crucial piece of the Bay Area’s transportation network, and the only way for people in Marin to reach San Francisco by bicycle. And yet, the bridge’s two sidewalks are a hotly contested space, shared by commuters, recreational riders, tourists, pedestrians, and maintenance workers alike, leading to predictably dangerous conditions for riders.
However, the Bridge is not a dangerous place for all its users. Compared to driving across the bridge, bicyclists are five times as likely to crash as drivers, and 21(!) times as likely to be injured. Not only does this represent a threat to current riders, it also discourages people from riding bicycles in a time when we need to be achieving a radical shift in our mobility choices.
To improve safety on the bridge, Golden Gate Bridge Highway and Transportation District (the District) has undertaken a bicycle safety study, which they are now releasing to the public via a virtual open house and public meeting. MCBC was consulted on the initial recommendations in March of this year. While we are happy to see that some of our feedback was incorporated, we still feel like the study falls short in important areas. This piece will dive into the study, highlighting what we like and what we feel could be improved, and explaining how you can get involved.
Good
Variable Message Guidance/Wind Alerts
For years, MCBC has been asking for the Bridge District to implement variable message signage to tell riders which side of the bridge they should use. While regular users eventually learn the byzantine rules about which sidewalk is open to bikes at what times, first-time or visiting riders often find themselves on the wrong side. Additionally, during high-wind events, to protect riders from the now-much-windier west sidewalk, the District will shift riders to the east side. Message boards will be placed at each approach to the bridge to inform riders which side they should use, saving people frustrating backtracking.
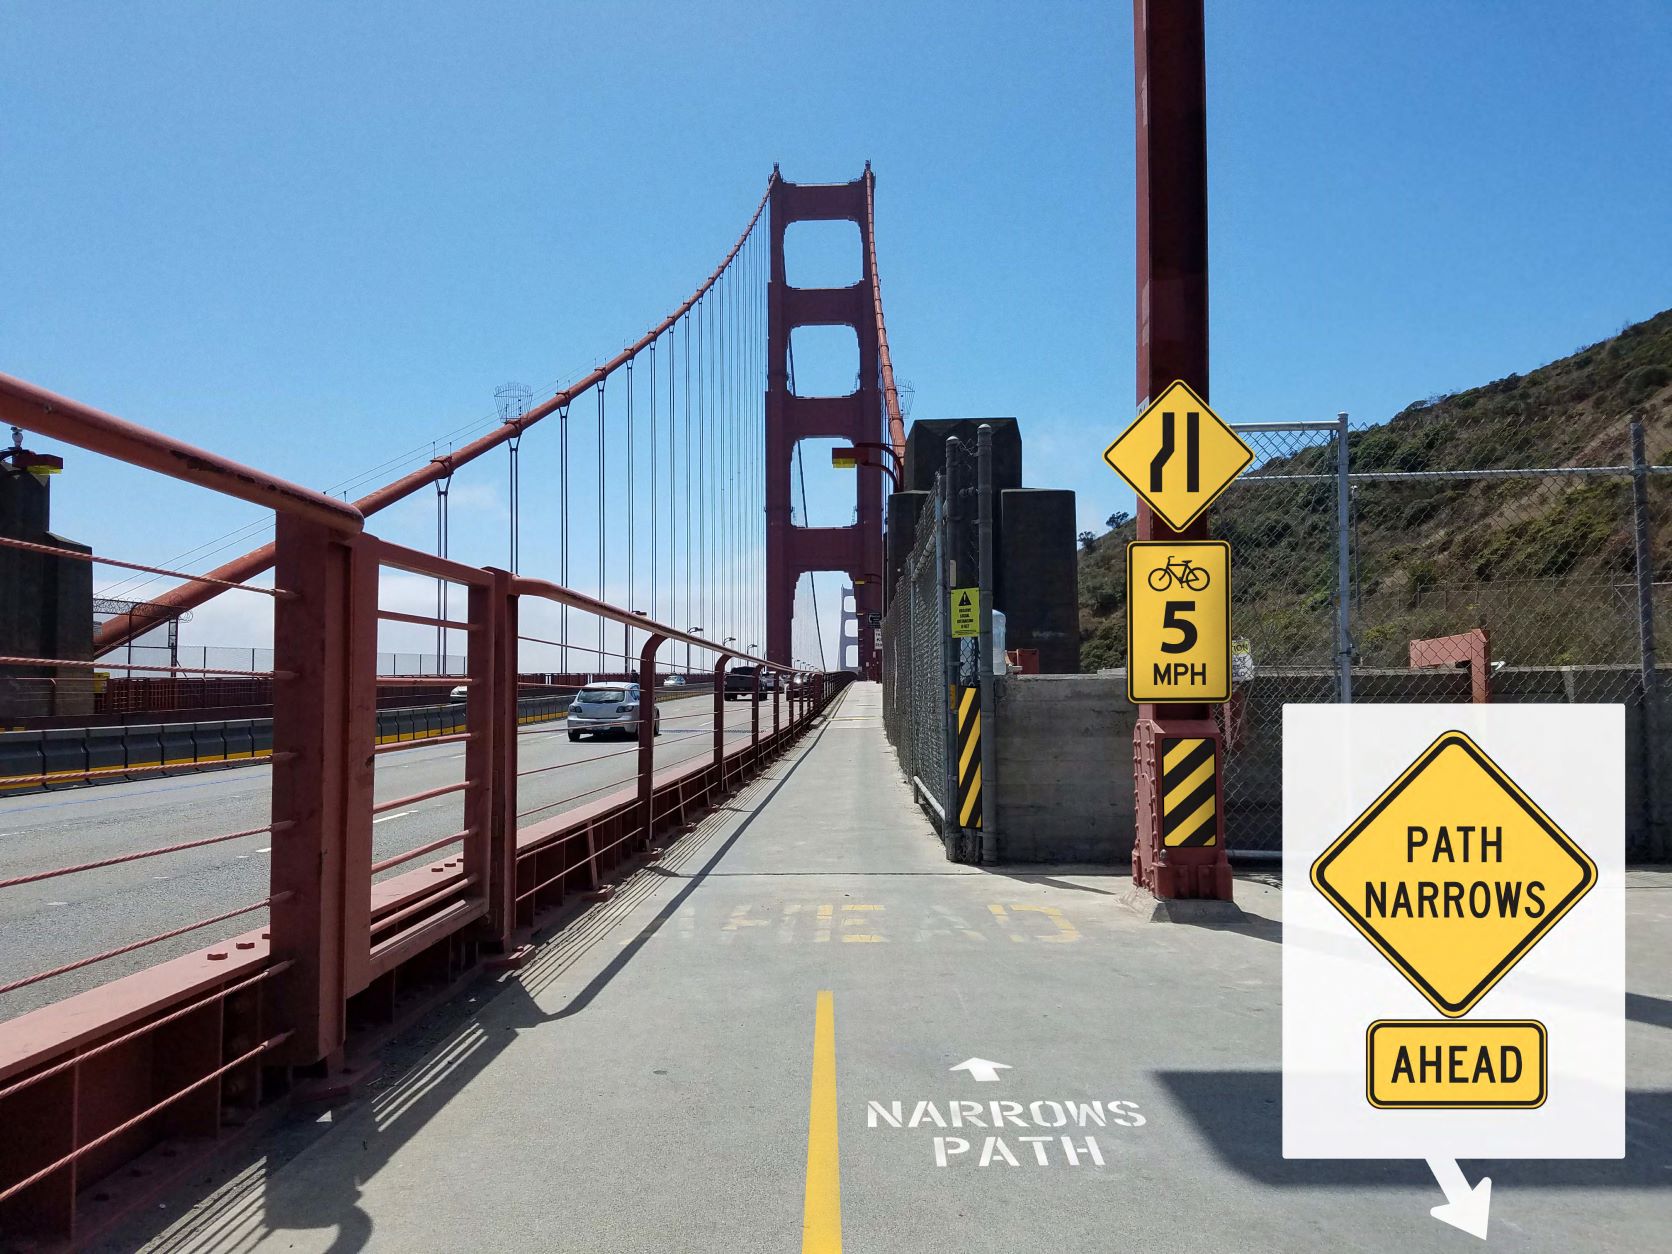
Additional Signage
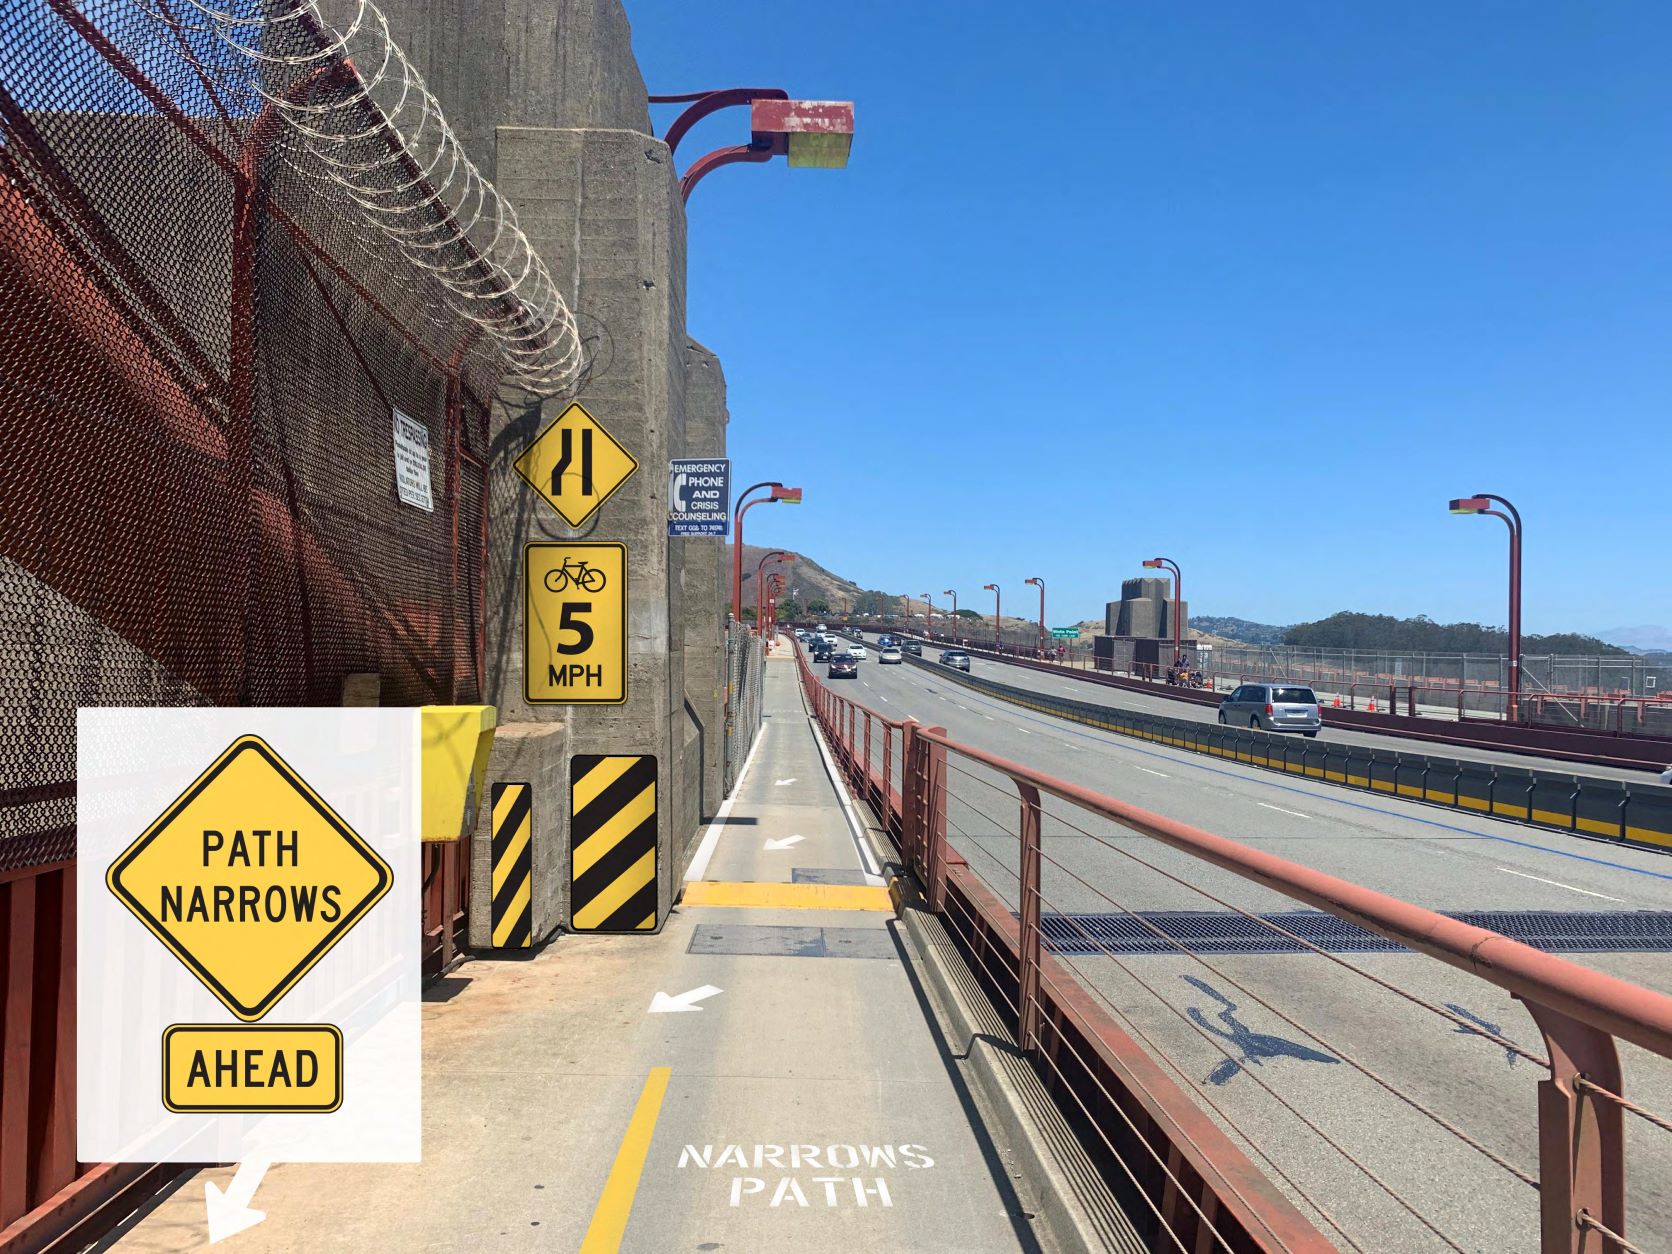
The Safety Study points out that “light pole 26,” where the west side reaches its narrowest point to pass the bridge abutment, is the spot on the bridge with the greatest number of reported crashes. The study recommends an advisory speed limit of 5 mph for this short section, and studying it further to determine if crashes are reduced. Further treatments could include a “yield to uphill traffic” sign (which we like) or one-way directional traffic controlled by a signal (which we don’t like).
Crash Reporting
The Bridge District will be rolling out a system by which people can report crashes, something that is not possible without the presence of a Bridge Patrol officer. While this does not directly improve the safety of the bridge, it can contribute to a more complete picture of how and where crashes are occurring, especially ones that wouldn’t result in a 911 call.
Less Good
Speed Limit
The study recommends a speed limit of 15 mph on the bridge, with 5 mph advisory limits going around the Marin and SF towers, as well as at light pole 26 (see above). While there is nothing wrong with a speed limit (especially on the east sidewalk, which is shared with pedestrians), we remain cautious about how such a speed limit will be enforced. While we strongly encourage everyone to cross the bridge at safe speeds, we don’t want to see people being given citations for traveling 16 mph.
The Crash Analysis is Underwhelming
The report endeavors to explain what share of crashes were due to speed. However, the findings are so incomplete as to be meaningless. We are told that speed was “unknown” to be a factor in 77% of all crashes. Why is speed the only crash factor? No consideration is given to sidewalk width, wind impacts, or other weather variables, something many people will tell you contributed to their crash.
Additionally, no attempt is made to disaggregate crashes by cause and severity, something that limits the applicability of the recommendations. Are there locations where two-bicycle crashes happen a lot? Do all severe crashes happen in one place, or are they even distributed across the span? These details would give us more confidence that the treatments were made to address the causes.

Underreporting
The Safety Study states that 58% of reported crashes resulted in an ambulance ride. We know from other research that severe crashes (i.e. ones that would result in an ambulance ride) typically make up only about 10% of all injury crashes, suggesting that there is a substantial under-reporting problem.
This is likely caused by several issues. Solo bicycle crashes are notoriously under-reported, even if the crash is a bad one, because riders usually feel that they alone are to blame (even though bad infrastructure is typically at least partly responsible). Additionally, unless a crash is bad enough for the rider or another passerby to call 911, an incident would only be reported if a Bridge Patrol officer happened across the scene. Currently there is no clear method to self-report a crash (something the Bridge District has committed to working on).
This is backed up by the (non-scientific) survey MCBC conducted earlier this year. Of the 91 respondents who had experienced a wind-related bike crash on the Bridge, six of whom sought medical attention afterward, only one person filed a report. We feel that the 241 crashes considered by the Safety Study represent the tip of a very large iceberg, one that would only be revealed by improved self reporting, something that the bridge has committed to working on (see above). We are heartened by that, but will reserve judgment until we get to try out the reporting tool.
Construction Materials
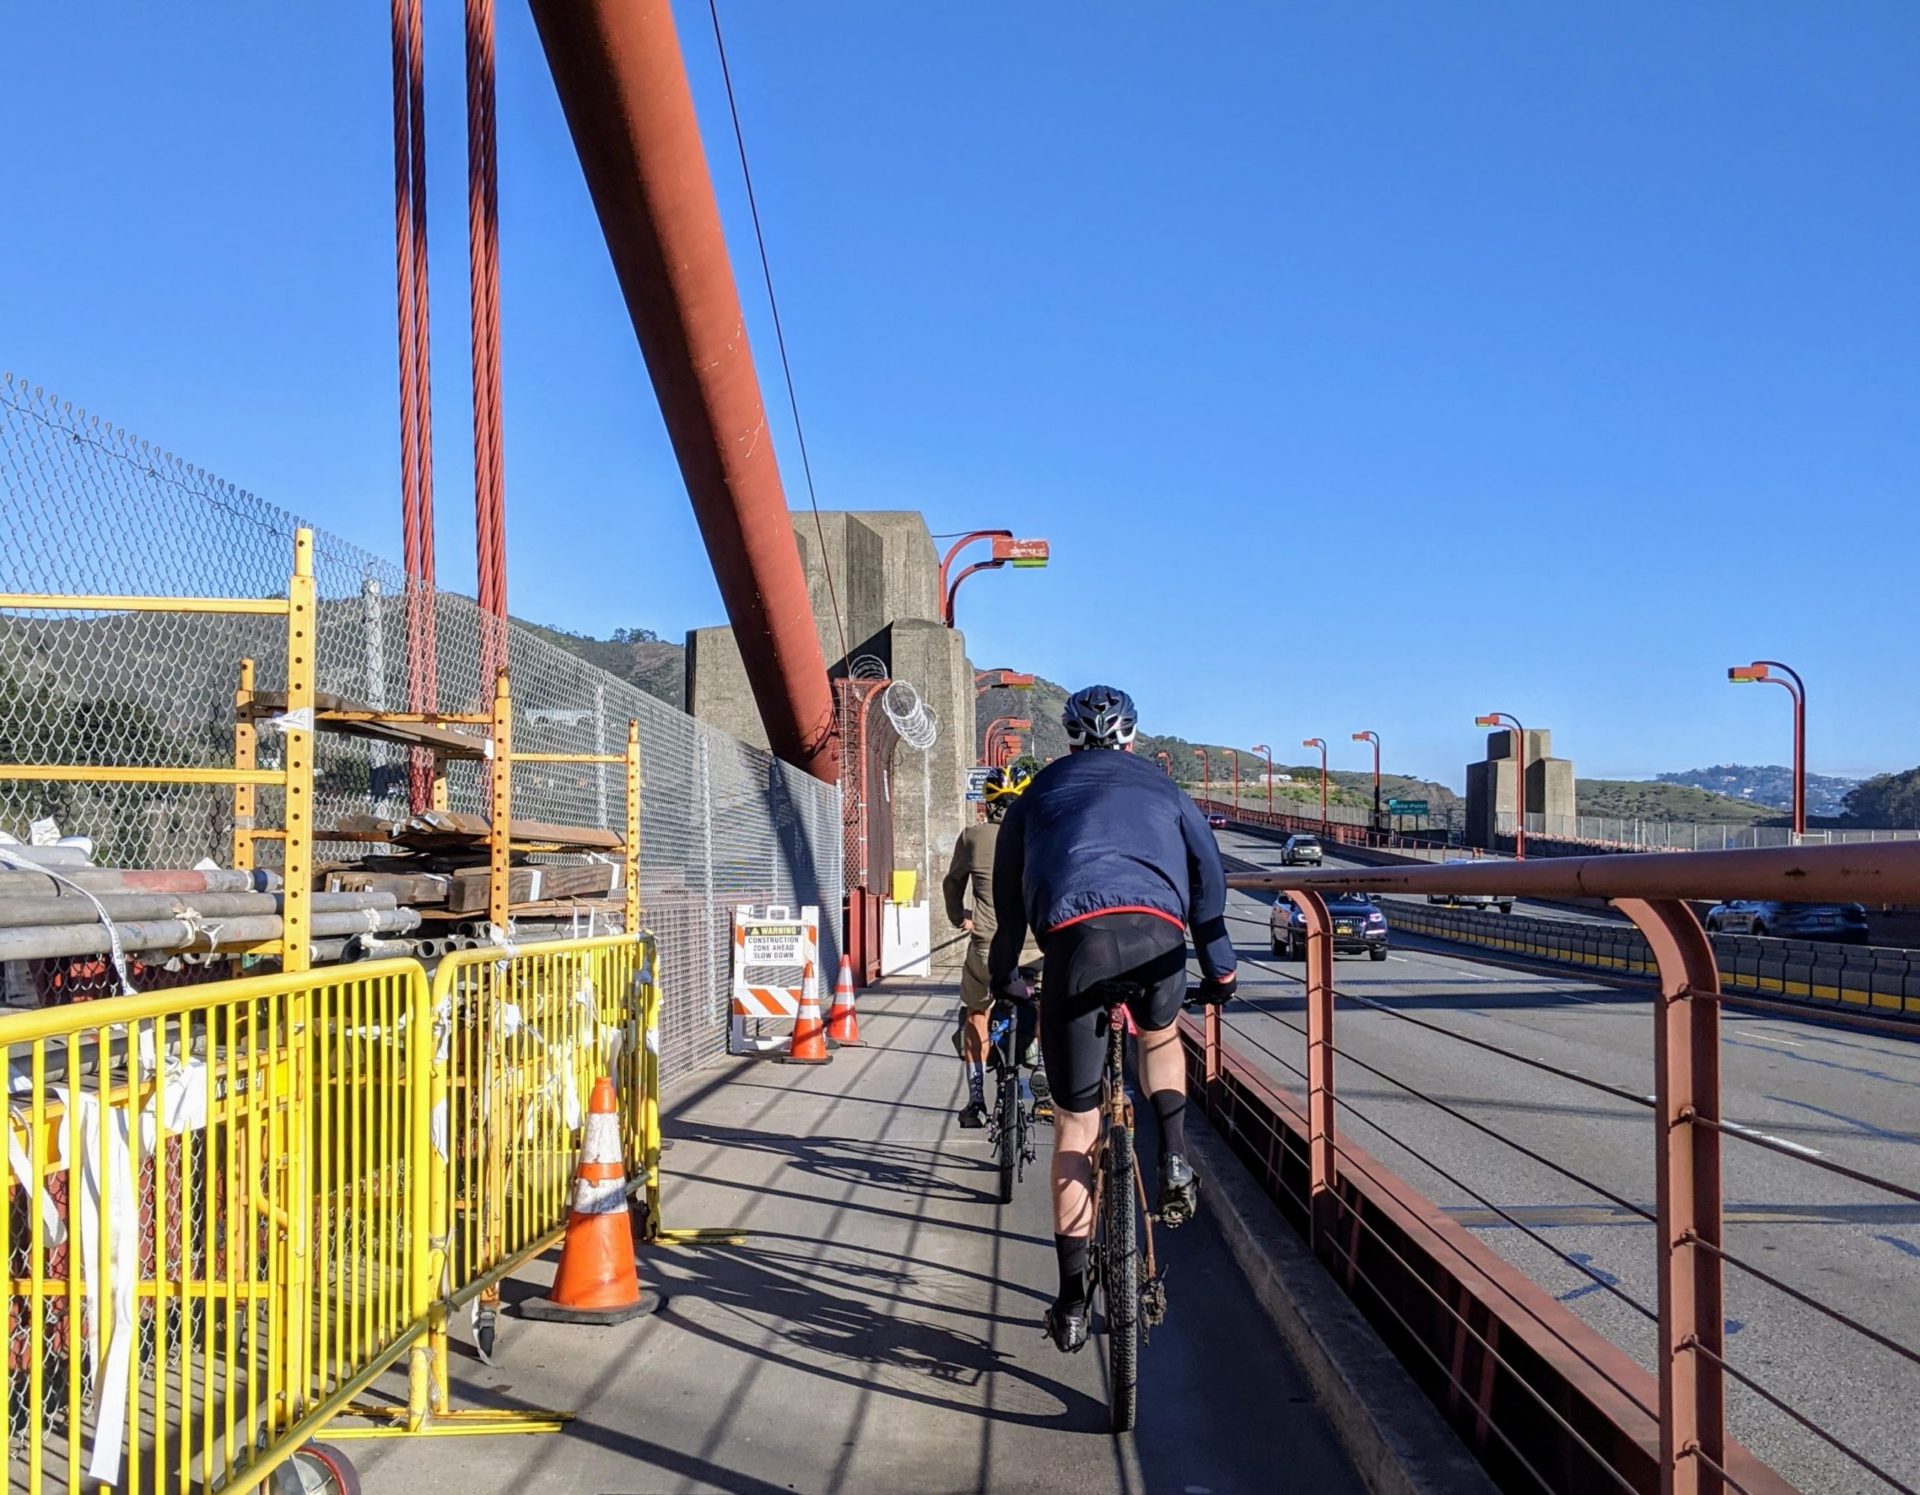
While the Bridge’s west sidewalk is reserved for bicyclists during the weekend and weekday afternoons, during other times it serves as the staging area for maintenance staff. As such, substantial amounts of construction materials are stored against the railing, further narrowing the sidewalk’s width and offering less room to maneuver. We are surprised to see that the study does not make any recommendations to increase clearances for two-way bike traffic going past construction materials.
What’s Next
Between Friday, September 24th and Sunday, October 10th, the Virtual Open House will be live. You can see the recommendations described above and give feedback in the “Comments” section on the last page of the open house. Feel free to write your own, or use ours with your own additions (see below).
Additionally, there will be a live Zoom Town Hall on Wednesday, October 6th at 12 PM (register here). It will be very important to get people to show up for that.
Below are our requests for the Bridge District. We need your help to make the Golden Gate Bridge a safer, more enjoyable place to ride for people of all ages and abilities.
-
The variable message signs are proposed at four locations: East Lot, Battery Trail, and Merchant Avenue (on the San Francisco end), and Alexander Avenue (on the Marin end). We recommend an additional sign on Conzelman Road just uphill from Alexander Ave on the west side of the bridge.
-
Construction materials on the west sidewalk narrow the pathway to a dangerous amount and limit maneuverability. Greater clearances should be required to accommodate two-way bike traffic.
-
More analysis is needed to better link the cause of severity of crashes to the proposed treatments.
-
Speed enforcement should be minimized, and limited to warning/citation for reckless riding, rather than minor violations of the speed limit.
-
A self-reporting tool is very important. Once tested and implemented, it should be well signed on the bridge deck to capture the greatest share of potential respondents.
-
The Bridge needs a Bicycle Advisory Committee to report to the Board on matters of bicycle safety. There are currently advisory committees for both the ferry riders and bus riders, but the thousands of daily riders should also have a seat at the table.
-
Perhaps most important, the Safety Study should incorporate a goal of reducing crash rates for bicyclists crossing the bridge, something notably absent from the document
If you have your own suggestions, please email them to Warren@MarinBike.org
sign-up for advocacy alerts
We will need your help! Please sign-up for advocacy alerts using the form below and we’ll tell you when/how to support our efforts.
members make it happen
We’re working to make Marin more bike-friendly for people of all ages and abilities. Are you with us?